Structure
We can divide the pricing plan information page into two sections: on the left, the pricing plan itself, and on the right, several panels with complementary information.
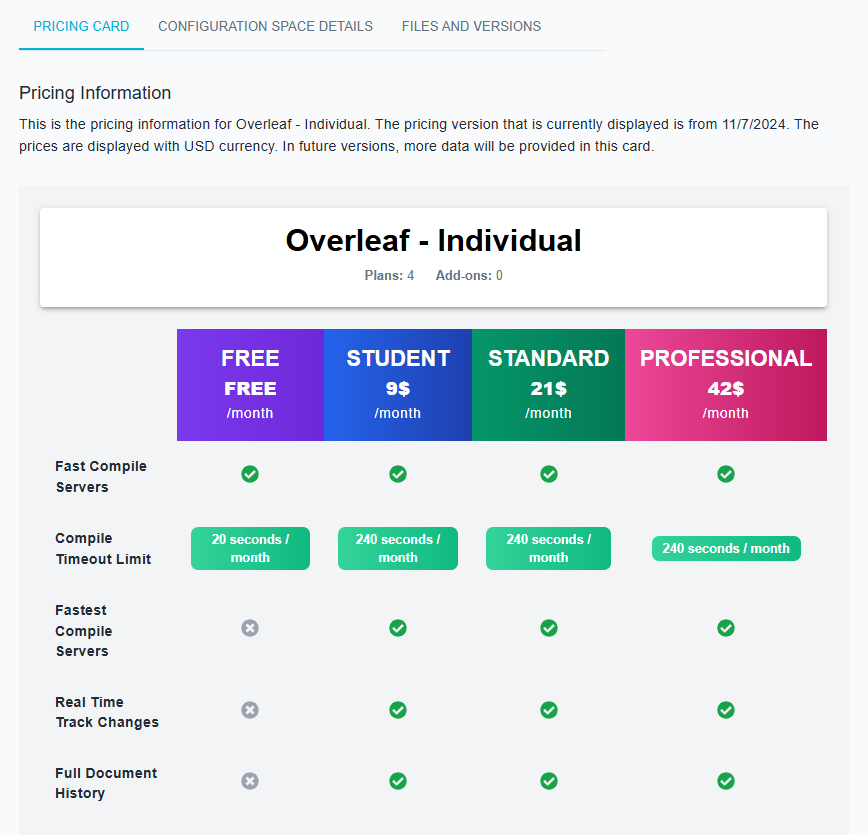
Pricing information
In this section, you can view the rendered pricing information from the Pricing2Yaml file you uploaded. It follows the standard structure of a pricing table: the Y-axis lists the features, the X-axis lists the plans, and each cell indicates whether a feature is available for a given plan or specifies its usage limit. At the bottom, you'll find the add-ons that can be optionally purchased.
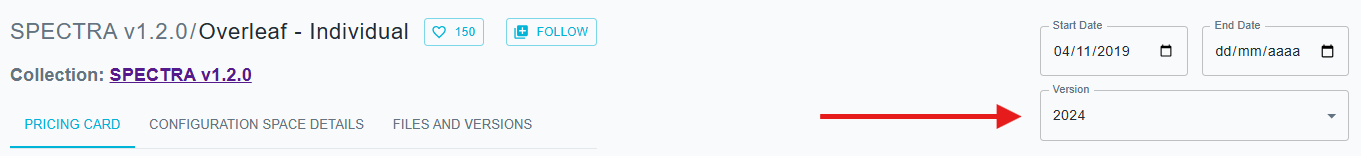
If your pricing belongs to a collection, you can switch between different pricings using the Version selector in the top-right corner of the view.
Statistics
In this section, you can view the total number of subscriptions for the pricing, as well as the minimum and maximum costs.

Analytics
In this section, you can view aggregated pricing data. By clicking the icon in the top-right corner, you can expand and explore additional statistics:
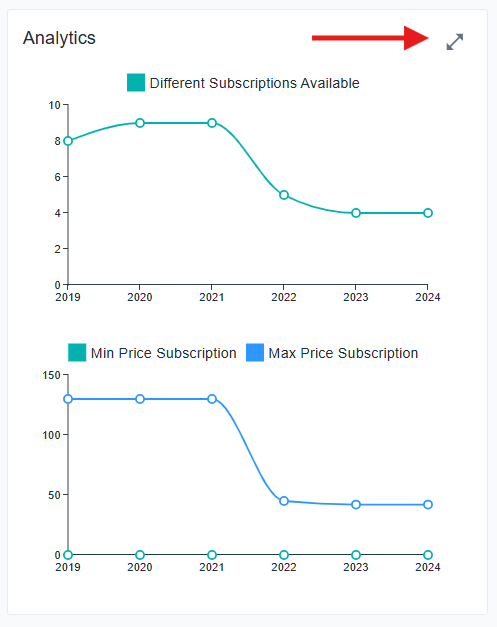
The following metrics are available:
- Number of Possible Subscriptions Over Time
- Price of Subscriptions Over Time
- Number of Plans Over Time
- Number of Features Over Time
- Number of Usage Limits Over Time
- Number of Add-Ons Over Time
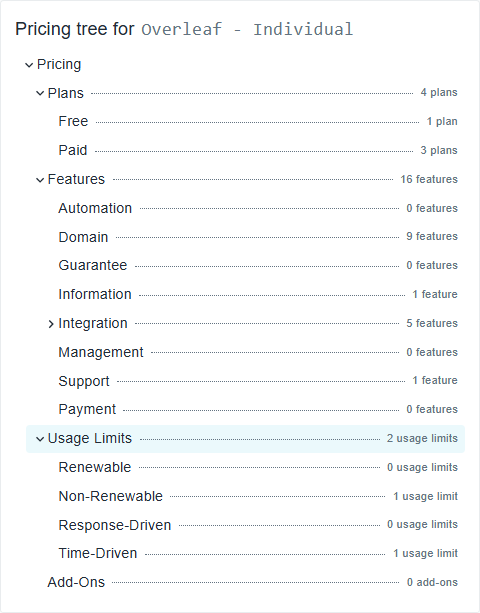
Pricing tree
This section displays a pricing summary in a hierarchical tree structure, you can expand each section to see the information.